Understanding Crypto Cycle: A Practical Guide for Traders
The cryptocurrency market is constantly evolving — it moves in cycles, with fluctuations at every turn. Understanding how to identify shifts in trends and make timely decisions can greatly enhance the profitability of your trades. Discover how to potentially predict market movements using a practical, hands-on approach.
Trade cryptocurrencies on WhiteBIT AU
What Are Market Cycles?
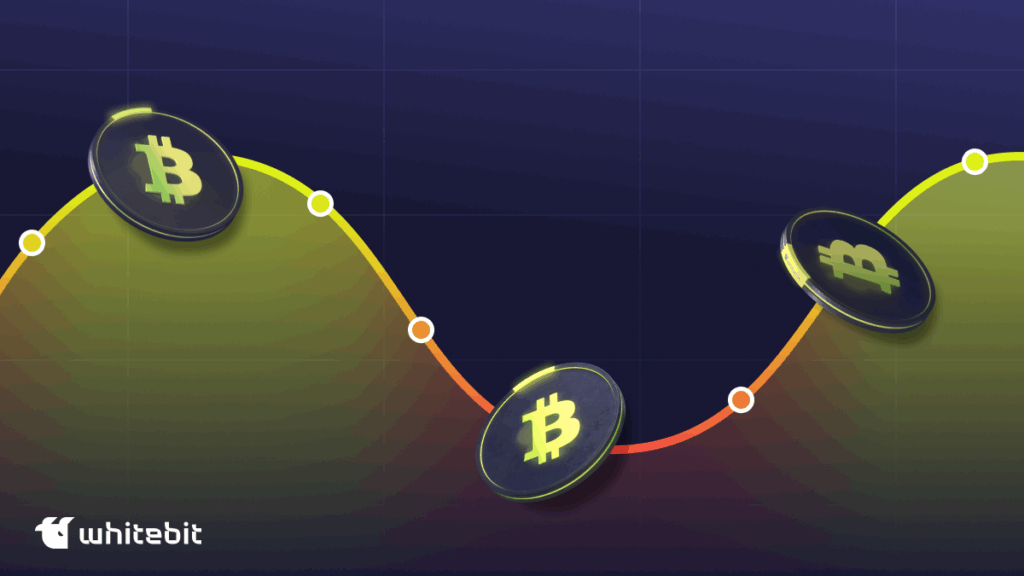
Market cycles are recurring phases that shape price trends in markets, including cryptocurrencies. These cycles include: the accumulation phase, where seasoned traders buy assets during periods of low volatility; the acceleration phase (markup), marked by a sharp rise in demand and prices; the distribution phase, when major players take profits amid overbought conditions; and the correction or bear cycle crypto (markdown), where prices decline due to large sell-offs and waning interest. Grasping these bitcoin market cycle stages allows traders to potentially enter positions at the start of an uptrend and exit before the downtrend begins, thus aiming to minimize risk and maximize the effectiveness of their strategy.
How Crypto Market Cycles Work?
Cryptocurrency market cycles are recurring phases that the market undergoes over time, each with distinct characteristics and requiring different strategies for successful trading.
- Accumulation Phase. During this stage, the market remains relatively calm, with prices fluctuating within a narrow range. Large buyers and “whales” begin to accumulate assets, capitalizing on low prices. Public interest in cryptocurrencies is still limited, and many market participants are uncertain about future growth prospects.
- Growth Phase. Following the accumulation phase, prices experience a sharp upward movement as demand starts to rise. More buyers enter the market, and mass buying intensifies. Prices surge rapidly, and the market enters a bullish trend. This is the most lucrative period for traders who enter the market early in the growth phase.
- Distribution phase. At this stage, large players begin to lock in profits by selling their assets, which leads to an increase in supply in the market. This can lead to a slowdown in price growth and the beginning of fluctuations. The market begins to stabilize, and there are often signs that prices may go down. Many traders, unaware of this moment, continue to hold their positions, hoping for further growth.
- Decline phase. Eventually, a correction phase sets in, when demand begins to fall and crypto prices decline. This can be caused by panic selling, deteriorating market sentiment, or a general decline in interest in cryptocurrencies. At this stage, the market usually experiences a bearish trend, and many buyers decide to exit, losing money.
Why Are Market Cycles Important?
The market cycle is crucial because it enables traders to accurately assess the current market environment, predict potential price shifts, and make informed decisions. By understanding the phases of the market — from accumulation to correction — and identifying key market cycle sectors, traders can minimize risks by entering the market during the growth phase and exiting during the decline phase. This approach enhances the chances of making a profit while safeguarding capital. A solid grasp of market cycles allows you to develop more effective trading strategies that are tailored to the specific conditions of the market.
Key Differences Between Cryptocurrency and Traditional Market Cycles
Cryptocurrency market cycles differ from traditional market cycles in several key aspects, particularly when considering crypto bull and bear market cycles. Firstly, cryptocurrencies are highly volatile, making their market life cycles more dramatic and shorter. Prices can fluctuate within hours or days, whereas traditional markets, such as stocks or bonds, tend to experience more gradual changes. Secondly, the cryptocurrency market is less regulated, contributing to extreme fluctuations and often creating speculative “bubbles.” In contrast, traditional markets are generally more stable due to strong regulations and significant institutional involvement. Finally, cryptocurrencies are heavily influenced by new technologies and innovations, such as blockchain updates or the launch of new tokens, which can rapidly alter market cycles. Traditional markets, however, are not as directly impacted by such fast-evolving technological trends.
Key Phases of the Crypto Cycle
Every cryptocurrency market goes through several distinct phases, each influencing the asset’s price.
- Accumulation is the phase when the market is relatively inactive, with prices staying within a narrow range. During this time, “whales” strategically buy assets without drawing attention from the broader market. It’s a waiting period, where growth seems uncertain, and most participants are unsure about the market’s future direction.
- Crypto bull market cycle — this phase marks the start of active price growth, drawing the attention of mass buyers. The market becomes optimistic, with cryptocurrency prices rising rapidly, which fuels increased demand. For traders, this is the most profitable phase, as prices soar.
- Distribution — during this stage, large players begin locking in profits by selling their assets, which leads to market saturation with supply. The market may stabilize or slow down, and many buyers fail to recognize the signs that the bullish trend is coming to an end, leading to potential misjudgments.
- Bear Market — this phase is characterized by declining prices as the market enters a bearish trend. Lower demand and massive sell-offs drive prices down, often causing panic among buyers. Those who failed to exit in earlier phases face the risk of losses during this downturn.

What Drives the Crypto Market Cycle?
The cryptocurrency market cycle is driven by a number of key factors, including:
- Macro Trends and External Factors — Global economic events, such as financial crises, inflation, shifts in exchange rates, or general economic downturns, can spark increased interest in cryptocurrencies as alternative assets. The market is also influenced by geopolitical instability and the rising demand for digital assets as a hedge against risk.
- Regulatory and Technological Catalysts — Changes in legislative initiatives and cryptocurrency market regulations can drive both price increases and declines. For instance, the adoption of cryptocurrencies as an official means of payment in certain countries or the integration of blockchain technologies into financial systems can significantly impact supply and demand. On the flip side, bans or stringent regulations in certain regions could lead to a sharp market downturn.
- Institutional Buyer Participation — Growing interest from large financial institutions, such as banks, hedge funds, and investment firms, as well as official announcements from major players about their plans to buy cryptocurrencies, often results in increased liquidity and price growth. The involvement of institutional buyers adds stability to the market and can influence the duration of bullish or bearish trends, driving longer-term price movements.
Analyzing Historical Market Cycles
The cryptocurrency market exhibits cyclicality due to several factors, including halving events, fundamental occurrences, and technical indicators.
Halving
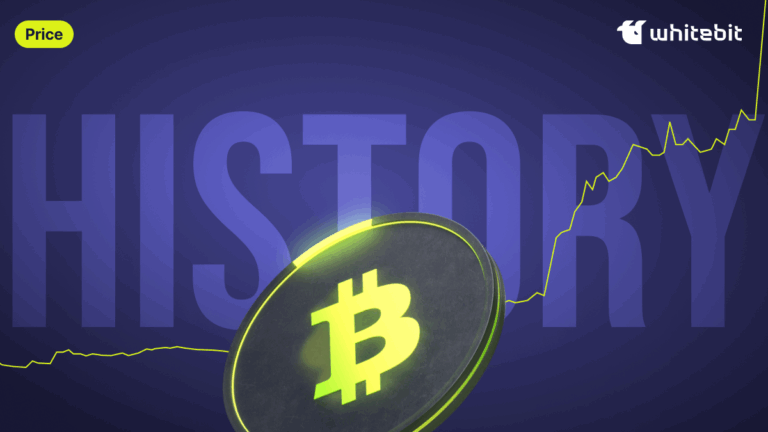
Halving is an event that takes place approximately every four years, during which the reward miners receive for mining a block is cut in half. This reduction in rewards leads to a decrease in the rate of new coin issuance, which, all else being equal, can drive up the value of the asset. Historically, after halving events, the price of bitcoin has tended to rise, a trend supported by the Stock-to-Flow (S2F) model, which compares the current supply of an asset to its annual supply.
The chart below illustrates Bitcoin’s price movement following each halving event:
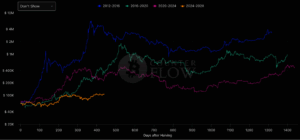
Bitcoin growth cycles after halving. Source: https://bitcoincounterflow.com/
Impact of Fundamental Events
Fundamental events, such as news about cryptocurrency regulation, political statements, or economic crises, can have a significant impact on the market. For instance, in June 2025, the US Senate passed the GENIUS Act, which regulates stablecoins, boosting confidence in cryptocurrencies backed by fiat currencies. This legislative move helped stimulate institutional interest, contributing to the growth of the cryptocurrency market. As a result, the market capitalization of stablecoins reached a record $251.7 billion.
The Role of Technical Indicators
Technical analysts use various indicators, such as the Relative Strength Index (RSI) and Simple Moving Averages (SMA), to assess whether an asset is overbought or oversold. These tools help predict potential trend reversals and identify optimal moments to enter or exit the market. Additionally, patterns like “head and shoulders” or “double top” can be used to pinpoint likely trend changes, enhancing decision-making strategies.
Evolution of Cryptocurrency Cycles
Over time, the cryptocurrency market has evolved. In its early years, market dynamics were highly speculative and prone to sharp fluctuations. However, with the growth of institutional buyers and the emergence of new technologies like DeFi, the market has matured and become more stable. Despite this progress, the cyclical nature driven by halving events and other factors remains an essential feature of the market.
How to Identify Crypto Cycle Phases?
To successfully identify the phase of the cryptocurrency market, it is important to pay attention to several factors. For example, in the accumulation phase, prices usually remain stable with low trading volumes, while in a bull market, rapid price growth and a significant increase in interest from new buyers can be observed. When the distribution phase begins, the market becomes more volatile, and large players start to take profits, which can trigger the first signs of a correction. During a bear market, prices usually fall, and panic sets in among buyers, indicating the end of the bullish trend. These observations help to better understand trading market cycles and adjust your strategy accordingly.
Key Tools and Indicators
To effectively analyze the cryptocurrency market, it is essential to use a combination of key tools and indicators that can provide insights into price trends, market sentiment, and volatility.
Technical analysis indicators:
- Moving averages (SMA, EMA): Moving averages help smooth out price fluctuations and highlight long-term trends. For example, when a short moving average crosses a long one (from bottom to top), this may signal the start of a bullish trend.
- Relative Strength Index (RSI): The RSI indicator shows whether an asset is overbought or oversold. A value above 70 indicates overbought (potential sell), below 30 indicates oversold (potential buy).
- MACD (Moving Average Convergence Divergence): This indicator helps determine the direction of the trend, its strength, and possible reversals. When the MACD line crosses the signal line, it may indicate the start of a new trend.
Trading volume is one of the most important indicators because it helps to assess the strength of price movement. For example, if the price of a cryptocurrency is rising on high volume, this indicates strong support for the trend. If the rise occurs on low volume, it may be a false signal that does not support real interest.
Sentiment analysis:
- Social media and news feeds: Following the news and analyzing discussions on social media such as X, Reddit, or Telegram helps determine the overall market sentiment. For example, if discussions actively support the growth of a cryptocurrency, this may be an indicator of future demand.
- Fear and greed index: This indicator measures market psychology by showing how fearful or, conversely, greedy participants are. High values indicate greed, which may precede a correction, while low values indicate fear, which may signal a possible trend reversal.
Volatility analysis:
- Bollinger Bands: This indicator displays volatility on a chart using bands that narrow or widen depending on price fluctuations. When the bands widen, it can mean high volatility and a possible trend reversal.
- Average True Range (ATR): ATR measures volatility based on the difference between closing prices and the lows/highs of candlesticks. An increase in ATR indicates an increase in volatility.
Trading and Buying Strategies for Market Cycles
To trade successfully in bitcoin cycles, it is important to choose strategies that are appropriate for the current market phase.
Long-Term Holding with Dollar-Cost Averaging (DCA)
DCA (Dollar-Cost Averaging) is a strategy where a buyer consistently buys assets for a fixed amount, irrespective of their current price. This approach helps mitigate the impact of short-term market fluctuations and lowers the average purchase price over time. Given the cyclical nature of the cryptocurrency market, including the Bitcoin 4-year cycle, DCA can be an ideal strategy for long-term buyers. It allows them to accumulate assets during the accumulation and crypto bull run cycles, while effectively ignoring short-term corrections.
Advantages of DCA:
- Reduced risk of buying at the peak of the market.
- Ease of implementation and management.
- Ability to accumulate assets without the need to engage in active trading.
Swing and Trend-Following Strategies
Swing trading focuses on profiting from short-term price fluctuations. Traders employing this strategy aim to buy assets during correction phases (in bearish trends) and sell them at price peaks (in bullish trends). A key aspect of swing trading is the ability to identify trend reversals and use technical indicators to make informed decisions.
Trend Following Strategy
Trend following involves investing in assets that are showing a clear trend. Traders use indicators like moving averages to buy when the market is in a bullish trend and sell or reduce positions when the trend weakens.
Advantages of these strategies:
- Potential for short-term profits.
- Ability to use technical indicators for accurate entries and exits.
- Attracts active traders who want to take advantage of volatility.
Using Sentiment and Volume for Short-Term Trades
For short-term trades, monitoring market sentiment and trading volume is crucial, as these factors can provide insights into potential short-term price movements. Positive or negative news, social media discussions, and fear and greed indicators often serve as strong signals for decision-making. When combined with volume analysis, traders can gauge the strength of the current price movement. For instance, a significant rise in volume during a price increase may signal the start of a bullish trend, while higher volume during a price decline could indicate the market is in a correction phase or a bearish trend.
Advantages:
- Quick response to market changes.
- Shorter position holding periods, allowing you to potentially profit from short-term fluctuations.
Real-time cryptocurrency prices
Conclusion
Market cycle and market phase analysis is essential for successful trading and buying in cryptocurrencies. Key phases such as accumulation, bull market, distribution, and bear market significantly influence market behavior and decision-making. By understanding market cycles, traders can anticipate potential changes and minimize risks, which is crucial for achieving long-term success in the market.
FAQ
Crypto cycles may typically last anywhere from a few months to a few years, depending on market conditions and external factors.
A crypto bull cycle usually lasts between 6 months to 2 years, but this can vary based on market dynamics.
A bull cycle in crypto refers to a period of sustained price increase, driven by rising demand, buyer optimism, and growing market interest.
A cycle in crypto refers to the recurring phases of the market, including accumulation, bull market, distribution, and bear market, each with its own trends and behaviors.